Xuemin Ye ·Wensheng Bu ·Xiaofei Hu·Bin Liu ·Kuan Liang·Fusheng Chen
Abstract Tree competitiveness generally depends on trait plasticity in response to environmental change.The effects of nitrogen (N) and phosphorus (P) on leaf trait variability by species is poorly understood,especially in China’s subtropical forests.This study examined the seedling leaf traits and net primary productivity of all trees >5 cm DBH of two dominant species,Schima superba and Castanopsis carlesii,in an evergreen broadleaved forest fertilized with nitrogen (+N),phosphorus (+P),and nitrogen plus phosphorus (N+P).The effect of N on seedling leaf traits was stronger than P,while fertilization in general was species dependent.Leaf mass per unit area decreased with N for S.superba seedlings but not for C.carlesii.Leaf N,P,and N/P ratios changed with N addition for both species.All four N fractions of carboxylation,bioenergetics,cell wall,and other N metabolites in C.carlesii leaves responded significantly to fertilization,while only the cell wall in S.superba leaves responded.Other leaf functional traits,including light-saturated photosynthetic rates,water,N,and P use efficiencies,chlorophyll and nonstructural carbohydrate contents increased with N addition in S.superba and by P addition in C.carlesii.Canopy closure at the stand-level increased due to N.Litter biomass and relative growth rate of S.superba was not affected by any treatments,while both for C.carlesii significantly decreased with N+P addition.Collectively,nutrient limitation may vary at a small scale among species in a subtropical forest based on their responses of seedling traits and net primary productivity to fertilization.Seedling traits are not correlated with the net primary productivity of larger trees except for N fractions,because low light conditions induced by fertilization reduces the proportion of N allocated to photosynthesis in seedlings.In addition,acclimation differences of tree species may increase the uncertainty of community succession.
Keywords Ecophysiology·Fertilization acclimation·N fractions·Nutrient limitation·Photosynthesis·Relative growth rate
Nitrogen (N) and phosphorus (P) are essential elements that may limit plant photosynthesis and primary productivity (Elser et al.2007;Vitousek et al.2010).Over the past several decades,elevated N deposition substantially modif ied nutrient availability,leading to nutrient imbalances and intensif ied P limitation,especially in tropical and subtropical forests (Vitousek et al.1997;Galloway et al.2004).Therefore,predicting and mitigating the effects of altered nutrient loading require an understanding of how trees adjust to local balances of nutrient supply and loss,and which nutrients alter forest primary productivity at what levels (Bubier et al.2011;Mayor et al.2014).Most recent nutrient addition experiments have focused on net primary productivity (NPP) and reported that the addition of N or P had positive,weak or no effects on stand productivity in tropical or subtropical forests (Cleveland et al.2011;Alvarez-Clare et al.2013;Tian et al.2017;Baez and Homeier 2018;Jiang et al.2018).However,it is not clear whether tree growth response to fertilization is accompanied by changes in leaf functional traits (e.g.,nutrients,physiological traits),and the effects of fertilization on local acclimation by individual tree species is often ignored.Therefore,the underlying adaptive mechanism,based on leaf functional traits and tree growth response to fertilization need to be further clarif ied.
Plants adapt their leaf morphological,physiological,biochemical and molecular properties by changing their functional traits to optimize nutrient acquisition and allocation.Several studies have observed that tree species have evolved several various plastic traits for use in response to environmental changes,allowing them to adjust to a wide range of ecological gradients (Lambers et al.2015;Marenco et al.2017).For example,leaf structural traits that respond to simulated N deposition or P input provide an important mechanism for acclimation to N-rich and P-poor conditions in tropical and subtropical soils,a fact supported by numerous field and laboratory experiments (Valladares et al.2002;Mao et al.2018).Leaf traits related to resource uses (light,water,and carbon) such as photosynthetic N,P and water use efficiency (PNUE,PPUE,and WUEi,respectively),as well as the production of chlorophyll and nonstructural carbohydrates also have been shown to play a vital role in plants under fertilization (Cui et al.2020).In addition,shifting nutrient allocation in leaves provides an alternative mechanism as to how species respond to exogenous nutrient supplies and loss,the trade-offamong N fractions or the composition of other leaf traits,and this may reflect a competitive ability within species associated with different strategies (Onoda et al.2004,2017;Minocha et al.2015,2019).However,how these various plastic traits respond to altered nutrient availability has not been studied thoroughly.The collective information from these approaches may provide useful and credible evidence of nutrient limitation and acclimation to fertilization.Phosphorus addition may increase soil nitrification rates and/or N2fixation rates,resulting in overall increased N availability for plants in P-poor soils,while the addition of N would decrease available soil P due to induce soil acidification (Chen et al.2016;Zhang et al.2018).In general,the P limiting of multiple ecosystem processes has been observed in tropical and subtropical forests,and the effect of P addition is greater than N addition.In a 10-year N and P fertilization experiment,the addition of P had positive effects on chlorophyll concentrations (Chl) in leaves in one of two understory species (Zhu et al.2014).Similarly,there was no effect on soluble protein,nonstructural carbohydrates (NSCs),and free amino acids to N addition,indicating that understory plants on reforested sites may be limited by light availability rather than by nitrogen (Bu et al.2019).However,plant responses being stronger for P addition and weaker for N addition were not supported in some studies in lowland tropical forests (Wright et al.2018).The effects of fertilization varied with tree species,sizes and niches due to their divergent functional trait characteristics and species-specific P allocation strategies (Baez and Homeier 2018;Mo et al.2019;Wang et al.2019).Thus,more research is needed to understand the effects of N and/or P additions on growth and leaf traits of specific species in subtropical forests.
There is limited data describing the response and acclimation of highly diverse,uneven-aged subtropical forests to elevated N depositions and alleviated P limitations.In this study,a long-term experiment on N and P additions was initiated in 2015 using a random block design in a secondary broadleaved evergreen forest in subtropical China.Two dominant species (Schima superbaGardner &Champ.) and (Castanopsis carlesii(Memsl.) Hayata),typical of subtropical forests in southern China,were selected as model species to study the effects of N and P additions on tree growth,seedling leaf traits related to structure,resource use (light,water,and carbon) and N allocation.It was hypothesized that:(1) the effects of P addition on seedling leaf traits and relative growth rates would be greater than with N addition;(2) N and P effects on leaf traits would differ among species,sinceS.superbaandC.carlesiiare considered to possess different (acquisitive or conservative) resource use strategies;(3) leaf N fractions would be the main factors that would influence seedling photosynthesis rates and relative growth rates under fertilization.Overall,species-specific responses in growth and leaf traits to N and/or P additions should help to understand and forecast the adaption of broadleaved evergreen forests to soil P limitations under atmospheric N deposition.
Site description
The study was conducted at the Jiulianshan Ecological Station (24°29’18’’-24°38’55’’ N,114°22’50’’-114°31’32’’ E,mean elevation 430 m),which is part of the Chinese Forest Ecosystem Research Network in Jiangxi Province.The site has a subtropical climatic with average January,July,and annual temperatures of 6.8 °C,24.4 °C,and 16.8 °C,respectively,and with average annual precipitation of 1927 mm (Ye et al.2019).The laterite soils are rich in iron and aluminum,and soil texture is mainly a clay loam,according to the China Soil Scientific Database ( www.soil.csdb.cn).The study was conducted in a well-protected,secondary broadleaved evergreen forest (> 40 years of age) with a canopy layer (diameter at breast height (DBH) > 5 cm,height > 5 m),an understory layer of saplings,shrubs,and seedlings (DBH < 5 cm,height < 5 m),and a groundcover layer of ferns and herbs.The average density and basal area of the stand were about 1100 trees ha-1and 25 m2ha-1,respectively.S.superba(33%),C.carlesii(22%),Castanopsis fargesiiFranch.(6%),andMachilus breviflora(Benth.) Hemsl.(5%) were the dominant species and accounted for about 70% of the total biomass.In the understory layer,the most common seedlings of dominant species wereS.superbaandC.carlesii.
Experimental design
A complete randomized block design (n=3) was established on the middle sections of two slopes.During 2015 and 2016,12 plots (20 m × 20 m) were established and randomly assigned to control,N,P,N plus P fertilizer treatments (+N,+P and N+P).All measurements were restricted to the center of each plot to reduce edge effects,each plot was at least 20 m from other plots to avoid any interference and contamination.In addition to the three control plots,+N,+P,N+P treatments were applied with 100 kg N ha-1a-1as NH4N O3/urea,50 kg P ha-1a-1as NaH2P O4,and both together.The fertilizers mixed with sand were sprayed on the soil surface.Fertilization was carried out every six months from March 2016 to March 2019.The control plots were sprayed with fine sand without N and P.Each plot was divided into four subplots (10 m × 10 m) to ensure better uniformity of N and/or P application within a plot.
After three years of fertilization,the understory seedlings of the two dominant species (S.superbaandC.carlesii) were selected.Both species are widely distributed and are dominant species of the generaSchimaandCastanopsis(families Theaceae and Fagaceae,respectively),in the subtropical forests of China,and have significant ecological and economical values.In each plot,three or more seedling of both species > 1 m in height were selected for measurements of photosynthetic and nutrient traits.In addition,all trees ofS.superbaandC.carlesii≥ 5 cm DBH were marked and their diameters monitored every six months using dendrometer tapes to assess the possible responses of growth rates or productivity to fertilization.
Soil physicochemical measurements
Composite soils of the upper 10 cm layer were randomly sampled within a plot and chemical properties were determined.Concentrations of mineral N (NH4+-N and NO3--N,KCl-extractable) and available-P (NaHCO3-extractable) were colorimetrically analyzed with a Smartchem140 analyzer (WESTCO Scientific,Brookf ield,USA).Soil pH was measured with a digital pH meter in a suspension with soil to water mass ratio of 1:2.5 (Liu et al.2015).
Measurements of leaf photosynthetic parameters
In July 2019,gas-exchange measurements were conducted with a Li-Cor 6400 portable gas-exchange system (Li-Cor,Lincoln,USA).The standard environmental conditions of the chamber block were established as a temperature of 25 °C,ambient CO2concentration of 400 μmol mol-1,and quantum flux density at 600 μmol m-2s-1for both species.All measurements were made on healthy,fully expanded,intact leaves near the top of the seedlings.The leaves were exposed to saturating light for 8-10 min before measuring to ensure photosynthetic induction and stomatal opening (Hikosaka et al.2006;Zhu et al.2014).Ambient CO2levels were prepared in a sequence of 400,300,200,100,400,600,800,1000 μmol mol-1and steady-state rates of net assimilation were recorded at each CO2concentration.The light-saturated photosynthetic rate (Pmax) was def ined as an ambient CO2concentration of 400 μmol mol-1at saturated light intensity measured between 8:00 and 11:30 am.The WUEi was calculated as the ratio of the rate of carbon assimilation (net photosynthesis) to transpiration rate.The photosynthesis model of Farquhar et al.(1980) was fitted to the net assimilation vs.intercellular CO2(Ci) response curves,the maximum rate of carboxylation (Vcmax) .The maximum rate of electron transport (Jmax) was estimated according to Niinemets et al.(2005).
Measurements of leaf traits
After measurements of photosynthetic gas exchange,leaves were put into sealed plastic bags,placed in an ice chest and transported to the laboratory.Samples were divided into five parts.One part of each sample was used to determine leaf mass per unit area (g m-2) by calculating the ratio of leaf dry weight divided by the leaf area (Kuusk et al.2018).The samples were dried to a constant weight at 65 °C for 72 h and then ground to a fine,homogeneous powder.The other parts of the samples (approx.1 g fresh weight) were cut up,placed into sealed plastic bags,and frozen at -20 °C until measurements of the cell walls were taken.The remaining samples were divided into three equal parts,each part cut into 0.2 g discs and placed in 2 mL microfuge tubes which were stored at -20 °C before taking measurements of starch plus soluble sugar (NSC) and photosynthetic pigments (chlorophyll).
Leaf N was divided into five fractions:carboxylation (PC),bioenergetics (PB),light-harvesting (PL),cell wall (Ncw),and other N metabolites (No).Cell wall material was extracted according to Onoda et al.(2004) and Feng et al.(2009).Fresh leaves were powdered in liquid N and suspended in sodium phosphate buffer (pH 7.5),the pellets were then dried (75 °C) for 2 days.Leaf N (Nleaf,mg g-1),P (Pleaf,mg g-1),and N in the final pellet were determined by a Smartchem140 analyzer (WESTCO Scientif ci,Brookf ield,USA) after the samples were digested with an 18.4 mol L-1H2S O4solution.The percent N fraction of the cell wall (Ncw) was calculated as N in the final pellet divide by leaf N.In addition,leaf concentrations of Chl a,Chl b,and carotene were extracted by 80% acetone and absorbance determined with a SpectraMax spectrophotometer (Molecular Devices,California,USA) at 470,663,and 646 nm wave lengths (Lichtenthaler 1987).A model was then used to determine N fractions of PC,PB,and PL as follows:N in No def ined as Nleafsubtracts all the N fractions of PC,PB,PL and Ncw.In addition,starch and soluble sugar were extracted by a reagent kit (Solarbio,Beijing,China) and determinations based on absorbance at 625 nm using the SpectraMax spectrophotometer.All indicators of N fractions were converted into percentages and calculated with Eqs.1,2,3,4;measurements of photosynthetic N and P use efficiency (PNUE and PPUE) were calculated with Eqs.5,6.

whereVcmax,Jmaxare def ined in the same way as in the measurement of photosynthetic gas exchange,Chl is the chlorophyll concentration,NleafandPleafare def ined as leaf N per mass and leaf P per mass,respectively,LMA is leaf mass per unit area,Ncwis the N fraction of the cell wall,andVcr,Jmc,andCBare constants which depend on leaf temperature (Niinemets and Tenhune 1997):

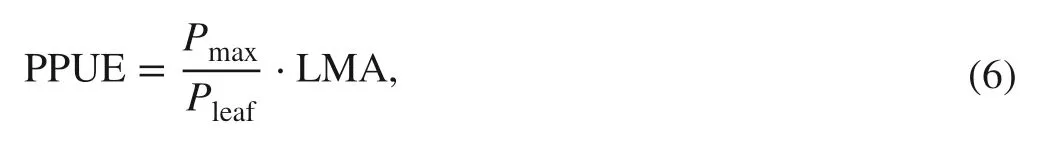
where thePmaxis def ined as the leaf light-saturated photosynthetic rate.Nleaf,Pleafand LMA are def ined above.
Measurements of DBH and canopy closure
In June 2015,stainless steel dendrometer bands were installed on each labeled tree > 5 cm DBH at 1.3 m above the ground.The changes in the gaps on the tapes were measured using a Vernier caliper after one month (July 2015) until the tapes and springs stabilized.Measurements on each band were recorded every six months starting July 2015.The basal area (BA) of the trees was calculated using the following Eq.(7) (Tian et al.2017):

where DBH0represents the initial DBH (cm) of trees measured in June 2015,andX1andX0(mm) represent the widths of gaps on the tapes measured at timest1andt0(July 2015).
Relative growth rates (RGR,m2m-2a-1) are the ratio of the increase in BA per year (compared with the BA of the previous year),based on Eq.(8),which is similar to the method of Alvarez-Clare et al.(2013):

where BA1and BA0represent basal area measured at timest1andt0,respectively.
Hemispherical photographs were taken at the center of all subplots to estimate the availability of light using Gap Light Analyzer Version 2.0 software (Soto et al.2017).In July 2019,light availability was estimated as the diffuse and direct beam radiation computed as the percentage of growing season transmitted radiation (i.e.,light index as a percentage of full sun).Photographs were taken during the growing season under homogeneous diffuse skylight conditions,i.e.,during cloudy days or at dawn or dusk.Five photographs were randomly taken within each plot.In addition,litter biomass was measured using litter traps in 2018.
Data analysis
Linear mixed effects modelling was carried out to test the influence of species,and the addition of N,P and their combination on seedling traits and tree relative growth rates.Fixed effects included N,P addition,species,and their interactions,while plots within blocks were considered as random effects.Linear mixed effects model analyses were performed in R version 3.5.2,using the lmer function in lmerTest packages.One-way analysis of variance followed by multiple least significant difference comparisons was used to compare the indicators of soil physicochemical measurements,light availability,litter biomass,leaf traits,and relative growth rate in each treatment for each of the species.Statistical analyses were performed in SPSS software (version 20.0,Chicago,USA),normality and homoscedasticity of variables were assessed using quantile-quantile plots and Bartlett’s test.All the results reported were significant atP< 0.05.
Structural equation modeling (SEM) was carried out to analyze the effects of fertilization on the growth performance ofS.superbaandC.carlesiiseedlings via pathways among light,soil nutrients,and leaf traits,regardless of the effects of the addition of N or P.All predictors were standardized to a mean of 0 and a standard deviation of 1 to improve the interpretability of regression coefficients (Yuan et al.2019).Before structural equation modelling (SEM),a linear mixed model was used to compare the explanatory capacity of different combinations of variables for predicting the light-saturated photosynthetic rate (Pmax,reflecting the potential growth performance of seedlings).SEM analyses were conducted in AMOS 22.0 (AMOS Development Corporation,Spring House,USA).
Stand soil and environment characteristics
After three years of fertilization,total soil N,P,pH,NH4+-N,NO3--N and mineral N were not affected by any fertilizer treatments compared to the controls (Table 1).Available P increased with P addition,and mineral N/available P was generally highest in plots treated by N and in the controls,followed by N+P,and lowest with P addition (Table 1).Likewise,leaf litter was unaffected by fertilization (Fig.1 a),while canopy closure was 8% and 10% higher in plots treated with either N or N+P,respectively,than the controls (Fig.1 b).Both direct and transmitted radiation signif ciantly decreased in plots fertilized with N addition or N+P compared to the controls (Fig.1 c and d).

Fig.1 Leaf litterfall (a),canopy closure (b),direct radiation (c),and transmitted radiation (d) in a broadleaved evergreen forest treated by nitrogen and phosphorus addition.Note:CK=Control,+N=Nitro-gen addition,+P=Phosphorus addition,N+P=Nitrogen plus phosphorus addition.The bars indicate standard errors (n =3).The small letters indicate the differences (P < 0.05) among the four treatments
Leaf structural and nutrient traits
Leaf mass per unit area (LMA) was varied by species and affected by the addition of N and P and their interaction (Table 2).When analyzing by species,LMA significantly decreased inS.superbadue to N addition,but was significantly lower than by N+P addition.However,the LMA ofC.carlesiidid not respond significantly to any fertilization treatment (Fig.2 a).
Leaf N was signif ciantly affected by the addition of N and the interaction of N,P,and species (Table 2).It increased inS.superbatreated by N and N+P,while forC.carlesii,it was only higher when treated by N+P when compared with P alone (Fig.2 b).Leaf P levels did not change as a result of any fertilization treatment compared to the controls (Table 2,Fig.2 c).Similar to leaf N,leaf N/P ratios were altered by the addition of N and were significantly higher inS.superbathan with P addition,and higher inC.carlesiiwhen treated with N+P (Fig.2 d).

Fig.2 Leaf mass per area (LMA) (a),leaf N (b) and P (c) concentrations and N/P (d) of two tree species seedlings in a broadleaved evergreen forest treated by nitrogen and phosphorus addition.Note:CK=Control,+N=Nitrogen addition,+P=Phosphorus addition,N+P=Nitrogen plus phosphorus addition.SS= Schima superba,CC= Castanopsis carlesii.The bars indicate standard errors (n =3).The small letters indicate the differences (P < 0.05) among the four treatments within a species
The leaf N fraction of PC was only affected by N addition;PB and PL did not respond to any variables and their interactions.The fraction of other N metabolites varied with species,while Ncwwas affected by N and P addition;significant interaction was between N and P as well as between N and species (Table 2).ForS.superba,leaf Ncwsignificantly decreased in treatments with N when compared with the controls,while PC,PB,PL,and No were not significantly different among treatments (Fig.3).ForC.carlesii,leaf PC and PB increased with P,Ncwincreased with the addition of nitrogen but decreased with P and No only decreased with N addition compared with the controls (Fig.3).

Fig.3 Five leaf N fractions including carboxylation (PC),bioenergetics (PB),light-harvesting (PL),cell wall (Ncw) and other N metabolites (No) of two tree species seedlings in a broadleaved evergreen forest treated by nitrogen and phosphorus addition (CK=Control,+N=Nitrogen addition,+P=Phosphorus addition,N+P=Nitrogen plus phosphorus addition).Note:SS= Schima superba,CC= Castanopsis carlesii.The bars indicate standard errors (n =3).The small letters indicate the differences (P < 0.05) among the four treatments within a species
Leaf resource use efficiencies
ThePmaxwas affected by P while interaction was observed between N and P as well as between N and species (Table 2).Pmaxincreased significantly inS.superbawith N addition and was significantly greater inC.carlesiiwith the additionof P (Fig.4 a).There was a significant interaction observed between WUEi with both N and P as well as between N and species (Table 2).The WUEi pattern by each species was similar to those for leaf N concentrations (Fig.4 b).InS.superba,WUEi was significantly higher when nitrogen was added and in the combination of N+P compared to the controls.In contrast,WUEi did not reflect any treatments ofC.carlesii(Fig.4 b).
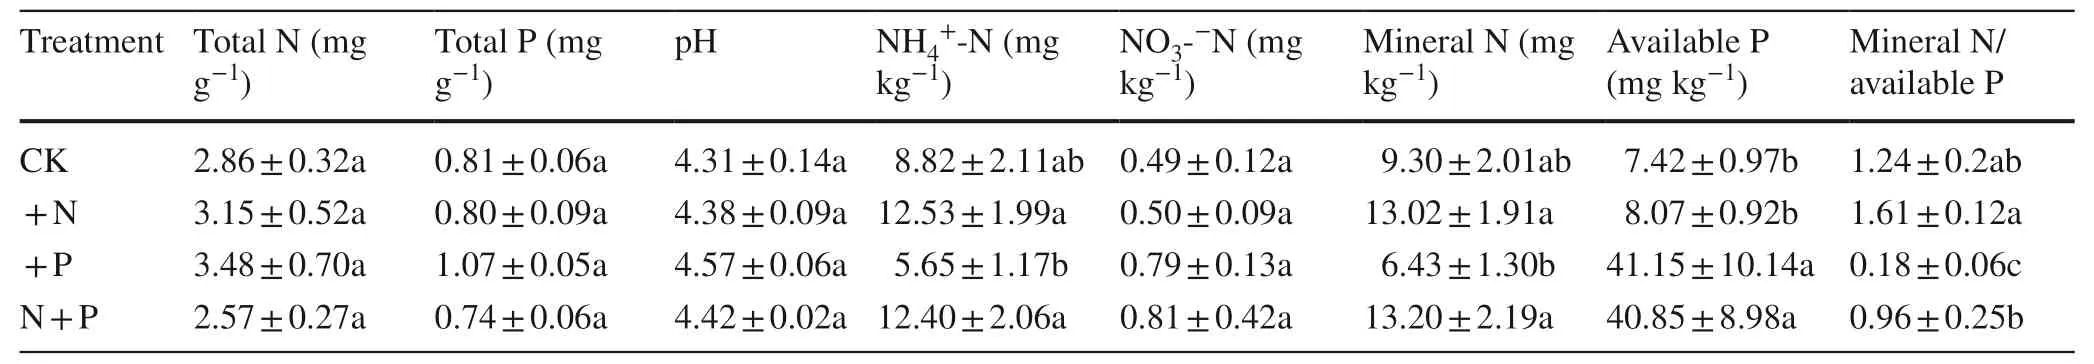
Table 1 Top soil chemical properties (mean ± standard error,n =3) in a broadleaved evergreen forest treated by nitrogen and phosphorus addition
Similar toPmax,PNUE was affected by P addition and there were significant interactions between N and P as well as between N and species (Table 2).PNUE was not affected to nutrient addition inS.superba(Fig.4 c),while it increased significantly whenC.carlesiiwas treated with P (Fig.4 c).Unlike PNUE,PPUE was affected by the addition of N and there was significant interaction between N and species (Table 2).The PPUE was higher forS.superbawhen N was added than with P and the controls and was significantly greater forC.carlesiiwith P addition than in the controls (Fig.4 d).

Fig.4 a Leaf light-saturated photosynthetic rate (Pmax),b water use efficiency (WUEi),c photosynthetic nitrogen use efficiency (PNUE),and d photosynthetic phosphorus use efficiency (PPUE) of two tree species seedlings in a broadleaved evergreen forest treated by nitrogen and phosphorus addition.Note:CK=Control,+N=Nitrogen addition,+P=Phosphorus addition,N+P=Nitrogen plus phosphorus addition.SS= Schima superba,CC= Castanopsis carlesii.The bars indicate standard errors (n =3).The small letters indicate the differences (P < 0.05) among the four treatments within a species
Leaf chlorophyll was significantly affected by the addition of N and varied with species (Table 2).Chlorophyll was the highest inS.superbawhen treated with N and forC.carlesiitreated with N+P (Fig.5 a).Leaf NSC and starch levels were affected by the added P (Table 2).Soluble sugar content was affected by both N and P and their interaction (Table 2).Soluble sugars and NSC were higher inC.carlesiitreated with P and N+P than by N alone,whileS.superbadid not show signif ciant differences among the four treatments (Fig.5 b and c).In contrast,starch was generally affected by P addition (Table 2) and was significantly higher inS.superbatreated with P than with N+P,as well as significantly higher inC.carlesiitreated with P than in other treatments (Fig.5 d).

Fig.5 a Chlorophyll,b nonstructural carbohydrates (NSC),c soluble sugar,and d starch concentrations of two tree species seedlings in a broadleaved evergreen forest treated by nitrogen and phosphorus addition.Note:CK=Control,+N=Nitrogen addition,+P=Phospho-rus addition,N+P=Nitrogen plus phosphorus addition;SS= Schima superba,CC= Castanopsis carlesii.The bars indicate standard errors (n =3).The small letters indicate the differences (P < 0.05) among the four treatments within a species
Tree growth
Tree relative growth rates (RGR) varied by species and ref lected significant interaction with both N and P (Table 3).ForS.superba,the RGR for all DBHs increased slightly (19.4%) and decreased slightly (12.7%) treated by P or N+P compared with the controls (Fig.6 a).In contrast,forC.carlesii,the RGR of all DBHs significantly decreased with N+P (Fig.6 b).

Fig.6 Relative growth rate (RGR) of Schima superba and Castanopsis carlesii for all DBH in a broadleaved evergreen forest treated by nitrogen and phosphorus addition.Note:CK=Control,+N=Nitrogen addition,+P=Phosphorus addition,N+P=Nitrogen plus phosphorus addition;SS= Schima superba,CC= Castanopsis carlesii. The bars indicate standard errors.The number in each histogram indicates the number of individuals in each treatment.The small letters indicate the differences (P < 0.05) among the four treatments within a species
Trait correlation networks and relationships between leaf traits and relative growth rates
Based on this preliminary analysis,soil available P,soil NH4+-N,LMA,leaf P concentrations and Ncwwere selectedas predictors in SEM analyses.Our SEM models provided the species-specific linkages among light availability,nutrient supplies,leaf nutrient levels,and seedling growth rates.In addition,the results of model fitting worked well for both species (Fig.7).ForS.superba,the pathways of leaf P and Ncwtogether explained 24% of the total variance ofPmaxwith decreasing available P,direct radiation,and Ncwdue to fertilization as well as increasing soil NH4+-N and LMA due to fertilization and elevated direct radiation (Fig.7,P< 0.05).ForC.carlesii,the pathways of soil available P,NH4+-N,and leaf P together explained 31% of the total variance ofPmaxas decreasing soil available P and leaf P,while increasing soil NH4+-N was due to fertilization (Fig.7,P< 0.05).In addition,fertilization played significantly positive (0.17) and negative (-0.15) roles withPmaxforS.superbaandC.carlesii,respectively (Fig.7,P< 0.05).Moreover,there were positive and significant correlations between relative growth rates (RGR) and chlorophyll,between RGR and PL,and between RGR and No,while RGR was negatively correlated with Ncwand PB/No (Table 3).However,the other relationships between RGR and seedlings traits were statistically indistinguishable.
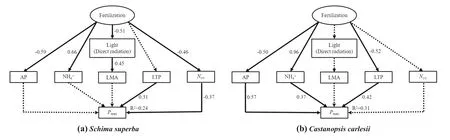
Fig.7 The structural equation models of fertilization effect on seedling growth potential (leaf light-saturated photosynthetic rate,Pmax) of Schima superba (a) and Castanopsis carlesii (b) via the pathways among light availability (direct radiation),soil nutrients (NH4+ -N and available P),and leaf nutrients (leaf P and Ncw) i n a broadleaved evergreen forest.Note:Results of model fitting:(a) χ2 =15.864,df=14,probability level=0.391,CMIN/DF=1.058,GFI=0.920,CFI=0.987;(b) χ2 =17.368,probability level=0.237,df=14,CMIN/DF=1.241,GFI=0.913,CFI=0.956.Solid arrows connecting the boxes indicate significant positive and negative effects (P < 0.05),respectively;the pathways without signif ciant effects are indicated by broken lines (P > 0.05).Values associated with solid arrows represent standardized path coefficients.LMA=leaf mass per area;LTP=leaf P concentration; Ncw =N fraction of cell wall; NH4+ =soil NH4+ -N;AP=soil available P

Table 2 Significance (P-values) from linear mixed model analysis for leaf mass per area (LMA),leaf N,P concentrations,N/P ratios,light-saturated photosynthetic rate (Pmax),chlorophyll,photosynthetic N use efficiency (PNUE),photosynthetic P use efficiency (PPUE),water use efficiency (WUEi),starch,soluble sugar,nonstructural carbohydrates (NSC) and leaf five N fractions including carboxyla-tion (PC),bioenergetics (PB),light-harvesting (PL),cell wall (Ncw) and other N metabolites (No) of two tree seedlings (Schima superba and Castanopsis carlesii) in a broadleaved evergreen forest treated by nitrogen and phosphorus addition (Control,Nitrogen addition,Phosphorus addition,Nitrogen plus phosphorus addition) NA and PA represent nitrogen and phosphorus addition effect,respectively.ns represents not significant at P > 0.05 level.

Table 3 Relationships of relative growth rate (RGR) to leaf traits across species in plot-levels in an evergreen broadleaved forest under fertilization treatments
Effects of the addition of N and/or P on leaf traits and tree growth
It has been hypothesized that a lack of phosphorous primarily limits NPP in subtropical and tropical forests (Vitousek et al.2010).In this study,inconsistent with this hypothesis,neither the addition of P nor N altered the relative growth rate (RGR) of each species or stand litter productivity,and total soil N and P,pH,soil NH4+-N,NO3--N and mineral N were not affected by any fertilization treatments.Previous studies have reported that the addition of P or N had no or little effect on tree growth in subtropical or tropical forests (Mosquera et al.2017;Tian et al.2017;Jiang et al.2018).The lack of response to N or P fertilization in this study are partially consistent with observations of species from tropical forests and might be supported in the following way.First,the effects of fertilization on growth rates may vary with species because of the differences in nutrient requirements and life history.Nutrient limitation occurs primarily at the species-specific level but not in communities in subtropical forests as supported by our results.Second,the low replication and high spatial site heterogeneity might have reduced the statistical power of fertilization in the stand.Third,mineral N was higher in+N and N+P plots compared to+P plots and available P was higher in+N and N+P plots compared to the controls.These results suggested that the effect of the additions of N and P might greatly change soil nutrient availability (Zeng and Wang 2015).This may further result in the limitations of other elements such as potassium or calcium rather than N or P (Wright et al.2018),as supported by the observation that N+P significantly decreased RGR in the present study.Collectively,N or P do not limit net primary productivity of these subtropical forests.
In this study,the effect of the addition of N on seedling leaf traits were greater than with the addition of P,which is inconsistent with our first hypothesis.Specifically,LMA,leaf nutrients and photosynthesis parameters were significantly affected by N or by the interaction between N addition and species,whilePmax,PNUE,NSC,starch and soluble sugars were affected by the addition of P.These results suggest that N limitation might still occur in seedlings of subtropical broadleaved evergreen species in the juvenile stage,and N limitations in tissues is not necessarily aligned with N limitations of aboveground NPP measured insitu.In lowland tropical forests,the meta-analysis revealed that P addition increased leaf P while added N slightly increased leaf N,which does not support the long-standing hypothesis that plant responses are stronger for the addition of P and weaker for N addition (Alvarez-Clare and Mack 2015;Wright et al.2018).Therefore,it was inferred that this forest might attain N saturation after three years of fertilization because it was not a rich N and poor P ecosystem as expected.
Interestingly,nutrient limitations based on seedling leaf traits and RGR of large trees were asynchronous.Most leaf traits had strong response to N addition while unchanged of RGR under any fertilization treatments.However,photosynthetic parameters were affected by N,P,and the interaction between N and species.In fact,the few extant fertilization experiments from such systems have demonstrated that nutrient limitation can vary at very small scales among species (Sullivan et al.2014).These results may be attributed to the variations in nutrient and light requirements with a tree’s development stage.At the plot level,canopy closure was greater under N+P and+N treatments than that in+P and the control plots,and both direct and transmitted radiation generally showed an opposite trend.Thus,seedlings would be limited by light and nutrient availability compared with larger trees which respond actively to nutrient additions.Overall,there was no prevalent nutrient limitation in our study forest at the plot level,while seedlings were generally regulated by N and light availability.
Fertilization effects on leaf traits and growth of different species
Nitrogen and P storage in leaves provide a common way for trees to adapt to exogenous fertilizers (Meuriot et al.2004;Shane et al.2004).In this study,leaf nutrients in the dominant understory seedlings varied by species and with the addition of N and P fertilizers,which is consistent with our hypothesis and with previous studies (Phillips et al.2013;Chen et al.2015).Leaf N increased significantly inS.superbawhen fertilized by N alone and by N+P,while inC.carlesiiit was higher when fertilized by N+P and not by P alone.The species-specific responses of leaf N indicate that P might play a more important role in regulating N uptake and transfer forC.carlesiithan forS.superba.Our finding that Ncwdecreased significantly with the addition of P supports this speculation.Additionally,species-specific responses of N fractions showed that Ncwdecreased inS.superbawith the addition of N,while Ncwincreased and No decreased inC.carlesiiwith the addition of nitrogen.These results reveal that the trade-offin N allocation to structural components and functional metabolites differ in species based on N addition.Furthermore,leaf P inS.superbawas higher in plots treated by P and by N+P than by N fertilization alone,whileC.carlesiishowed higher leaf P in plots treated with P than by N+P,suggesting that the interactive effects of N and P additions on leaf P differed between species.Overall,the species-specific responses of leaf N and P to fertilization could be caused by their differences in nutrient acquisition and N allocations,which is in agreement with our second hypothesis.
The effects of fertilization on leaf traits could be closely associated with conservative or acquisitive resource use strategies because leaves are used for photosynthesis and carbohydrate production (Wuerth et al.2005;Godoy et al.2011).Photosynthetic pigments are directly related to leaf functions,including light capture and photoprotection,and increase with the addition of nutrients,especially with adequate N (Luo et al.2015;Zhang et al.2018).In this study,leaf chlorophyll increased significantly with N as expected.Among the four treatments,chlorophyll levels peaked in both species when fertilized with N or with N+P.Leaf PNUE and PPUE are considered to be acquisitive resource use traits and would be rapidly upregulated when N and P are limiting (Funk and Vitousek 2007).Mao et al.(2017) found that PNUE increased in understory species by N fertilization.In the present study,PPUE increased inS.superbafertilized with N.PNUE did not respond to any treatment for this species.Therefore,it is speculated thatS.superbawould have a maximum photosynthesis rate in response to the addition of N by investing the N in chlorophyll for light-harvesting rather than by increasing N use efficiency,sincePmaxand Chl were the greatest forS.superbawhen fertilized by N.In contrast,PNUE and PPUE were greater forC.carlesiiwhen plants were fertilized by P than that in the controls,which suggests thatC.carlesiimight have conservative strategies associated with high N and P use effi-ciencies under P addition.This was verif ied by the observation that the addition of phosphorous increasedPmaxbut did not alter leaf P and Chl inC.carlesii.The response of water use efficiency (WUEi) to the addition of N and P ref lects the coupling between water and nutrient resources on tree growth potential (Lu et al.2018).In this study,WUEi was higher inS.superbawhen plants were treated with N and N+P than in the controls,while it was not affected inC.carlesiiby any fertilization treatments.This suggests thatS.superbahas acquisitive traits,allowing it to maximize water use efficiency with adequate N.In addition,leaf soluble sugars were higher inC.carlesiifertilized with P and N+P than by N alone,while starch was higher inS.superbatreated with P addition than in other treatments,which provided direct evidence of P regulating the NSC concentrations.
Interesting,the relative growth rate ofS.superbawas not altered by any fertilization treatment while that ofC.carlesiisignificantly decreased with the combination of N+P.These results reveal that the potential growth rates of tree species might be linked with mycorrhizal associations to fertilization (Cornelissen et al.2001;Jo et al.2019).Arbuscular mycorrhizal-associated species showed more increased growth in response to elevated inorganic nutrients compared with ectomycorrhizal-associated species,while an opposite response was found to inorganic P fertilizer.In addition,the seedling leaf N/P ratio significantly increased with N+P,further highlighting that additions of N and P might cause nutrient imbalance of an ectomycorrhizal-associated species such asC.carlesii.Clearly,consistent with the second hypothesis,leaf traits related to resource use also showed species-specific responses to alterations in N and P availability becauseS.superbapossesses an acquisitive resource use strategy whileC.carlesiihas evolved into having a conservative resource use strategy.These divergent trait characteristics mirror the position of the two species as intermediate transitional and climax dominant species,respectively,during community succession in a subtropical forest.
Relationships between RGR and leaf traits by species by fertilization
Consistent with our third hypothesis,the results show that RGRs were significantly correlated with N fractions (Ncwand PB/No) in the two species,because the addition of N accelerated canopy closure,low light condition reduced theproportion of N allocated to photosynthesis in seedlings.In addition,the same trade-offbetween Ncwand No due to N addition was supported by N fractions trade-offin the cell wall and Ribulose Bisphosphate Carboxylase/Oxygenase (RuBisCO) with N addition (Harrison et al.2009).These results suggest that changes in leaf N allocation (trade-offamong N investment in photosynthesis,cell wall and other metabolites) are an important mechanism that influences relative growth rates under fertilization rather than through changes in leaf traits related to structure and resource uses (Walker et al.2014).However,most leaf traits related to structure and resource use were not correlated to growth rates,the absence of correlation between leaf nutrient levels and growth rate was similar to a previous study in lowland tropical forest (Kitajima and Poorter 2010).Nutrient limitation in diverse tropical forests is a complex phenomenon,where different species,functional traits and size classes have different nutrient requirements that vary in space and time.Therefore,to obtain correlations between leaf traits and net primary productivity,it is necessary to carry out observations at a large spatial scale or in a low diversity/low nutrient system where responses to nutrient additions overpower natural variability (Sullivan et al.2014).
Yuan et al.(2019) found several factors that influenced tree growth and forest productivity,including soil nutrients,light availability,tree age,and trait composition,but their relationships were often overlooked.Our structural equation modelling not only showed how these linkages affect photosynthetic capacity under fertilization,but also provided the species-specific linkages among light availability,soil nutrient supplies,leaf nutrient levels and seedling growth rates,while a structural trait (LMA) driven by light availability might not promote increases in the rates of photosynthesis.Recent studies have found that extensive P limitation is not common,as some species grow rapidly on soil with extremely low P availability (Turner et al.2018).In this study,fertilization had significantly positive (0.17) and negative (-0.15) roles withPmaxforS.superbaandC.carlesii,respectively,in spite of the decrease in available soil P and increase in soil NH4+-N that resulted from fertilization,which provided the species-specific linkages among light availability,nutrient supplies,leaf nutrient levels,and seedling photosynthesis rates.
Our results provide evidence that nutrient limitation,based on seedling leaf traits and relative growth rates in subtropical broadleaved evergreen forests,is a complex occurrence.Seedling traits responded to the addition of N while growth rates were unchanged by fertilization.In addition,our findings also highlight the species-specific leaf traits in response to N and P fertilization as a result of differences in adaptive strategies of the two species.S.superbashowed a strong ability to adjust and coordinate leaf structure,resource use,and nutrient allocation in response to N availability,and to adapt to and benef it from short-term N deposition.In contrast,C.carlesiishowed positive effects related to the P addition,indicating that this species might be more easily limited by P def iciency.Therefore,we speculate that the present situation of N deposition and aggravated P limitation would be disadvantageous to the succession of subtropical broadleaved evergreen forests.Careful consideration must be given to species differences in leaf traits and growth in response to global changes,and thus provide sufficient data to forecast future forest vegetation dynamics.
AcknowledgementsWe greatly appreciate Yong Lin and Wei Chen for their help in field sampling and laboratory measurement.